Anthropic's IPO: what 307 mega-IPOs say about the price, the first day and the year after
A pre-registered study of 307 hand-collected US IPOs of $1bn+ (in 2026 dollars) since 1996, a valuation check and a look at who is buying, published before Anthropic prices on 18 November. We state our predictions now and will score them after the shares trade.
This is a research preview written before Anthropic (Nasdaq: ANT) sets its IPO price, expected on Wednesday 18 November 2026. It combines a hand-built sample of 307 US mega-IPOs, a valuation check against listed peers and published valuations, and a review of the deal's buyers and supply schedule. The hypotheses, sample rules and tests were written down before any data was collected; every later change is listed in the method section. Labels: Fact (directly from a cited source), Estimate (a number that is itself someone's estimate), Interpretation (a reading that informed people could dispute), Speculation (a conjecture). This is analysis, not investment advice.
Key takeaways
- Mega-IPOs are underpriced like other IPOs. In our sample of 307 US IPOs of $1bn or more (2026 dollars) since 1996, the average first-day return was 20.2% (median 10.6%), and 16.4% closed below the offer [1, 2, 3]. That is close to the 19.0% average for all US IPOs since 1980 [4]. We cannot reject that big deals pop as much as the average IPO of the same year (p = 0.28), though the gap becomes significant if the 26 deals we could not price are assumed to have done badly [1, 2, 3, 4]. Against IPOs by firms with large sales, megas popped 8.8 points more [1, 2, 3, 4]. (Fact, from our data.)
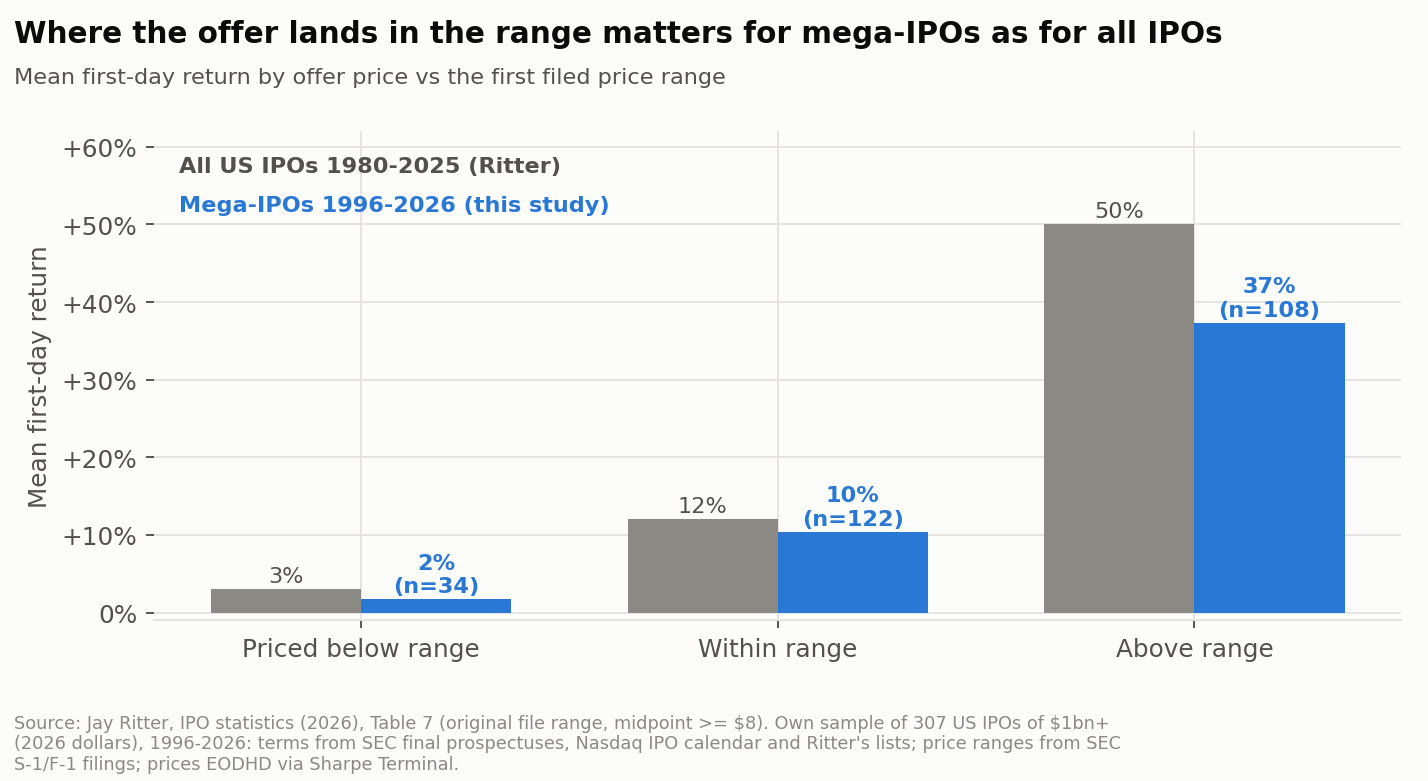
- The single best predictor is where the price lands against the first range. Each percentage point the offer is raised above the midpoint of the first filed range adds about 1.7 points to the first-day return; cuts barely matter [1, 2, 3, 5]. Deals priced above their range rose 37% on average, those inside it 10%, those below it 2% [1, 2, 3, 5].
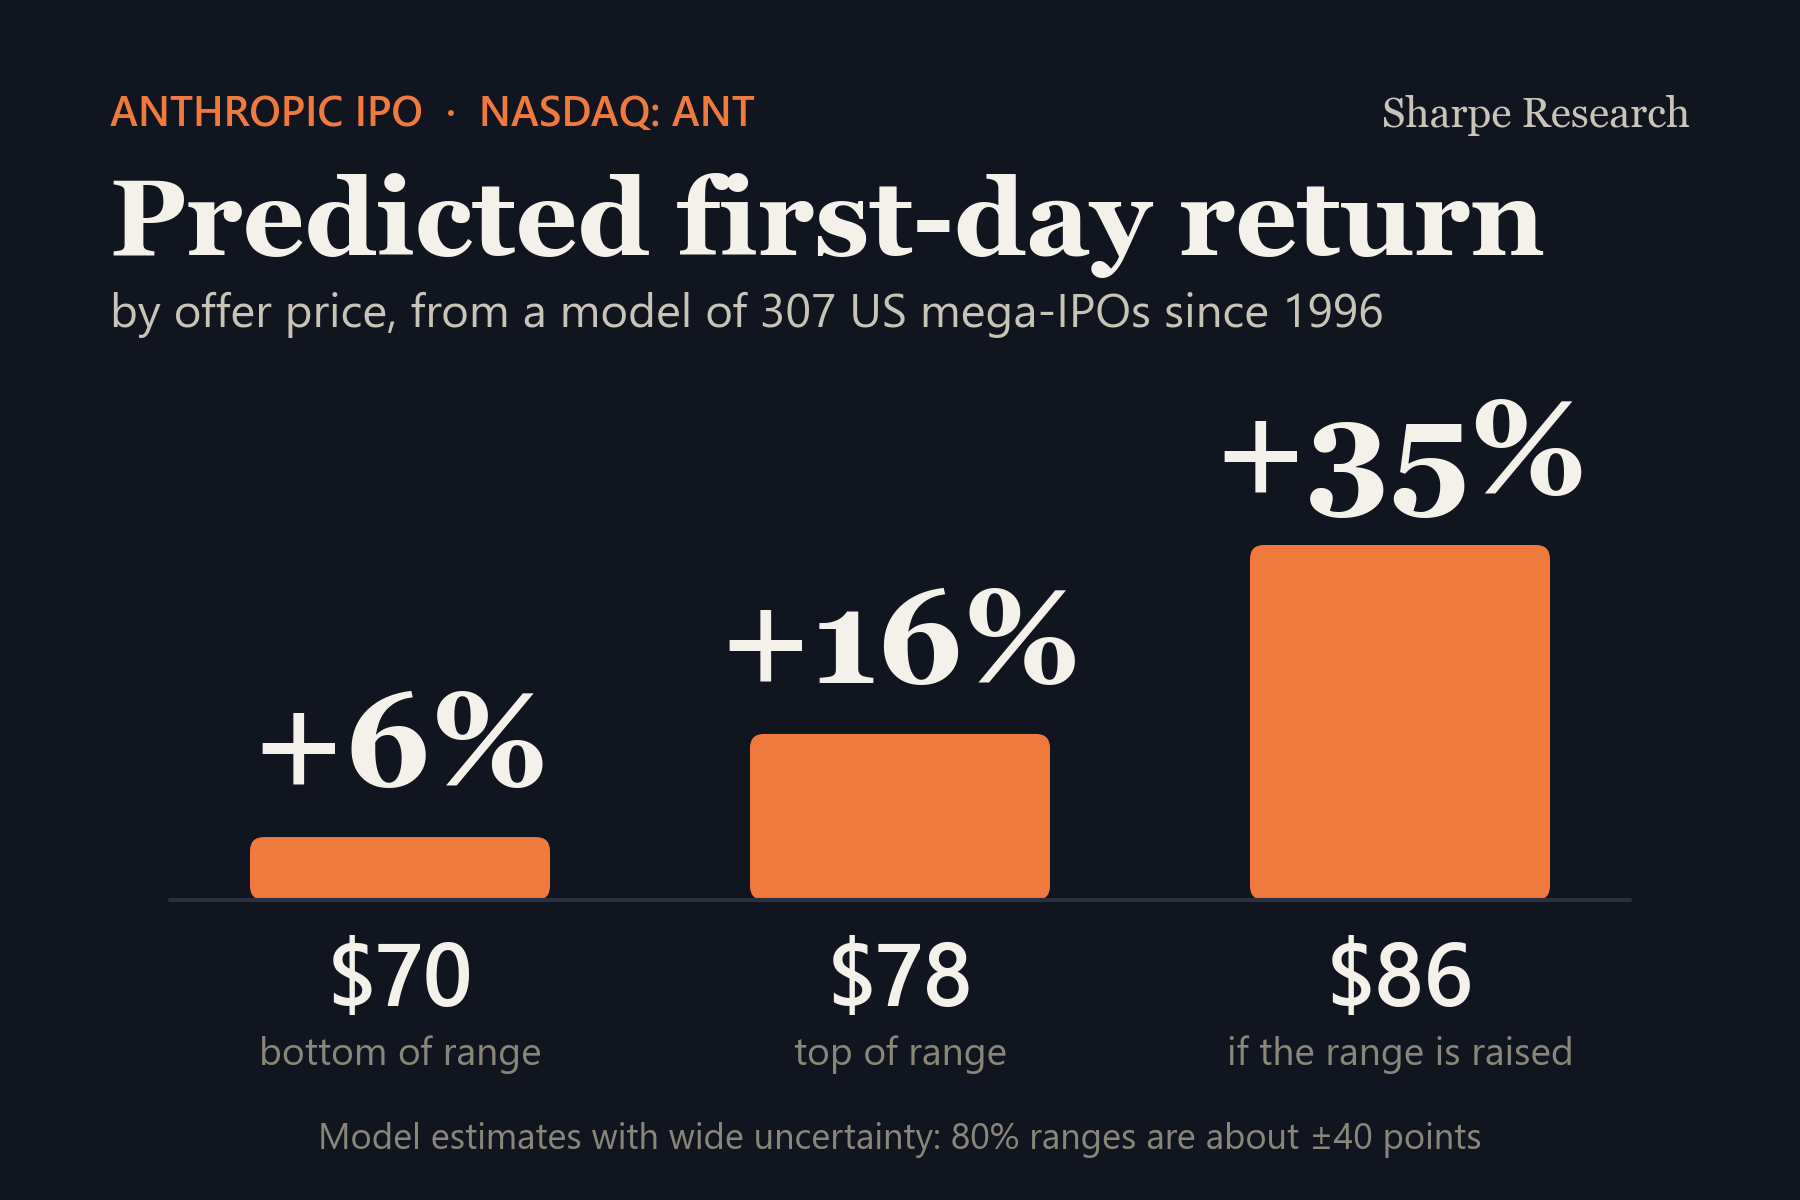
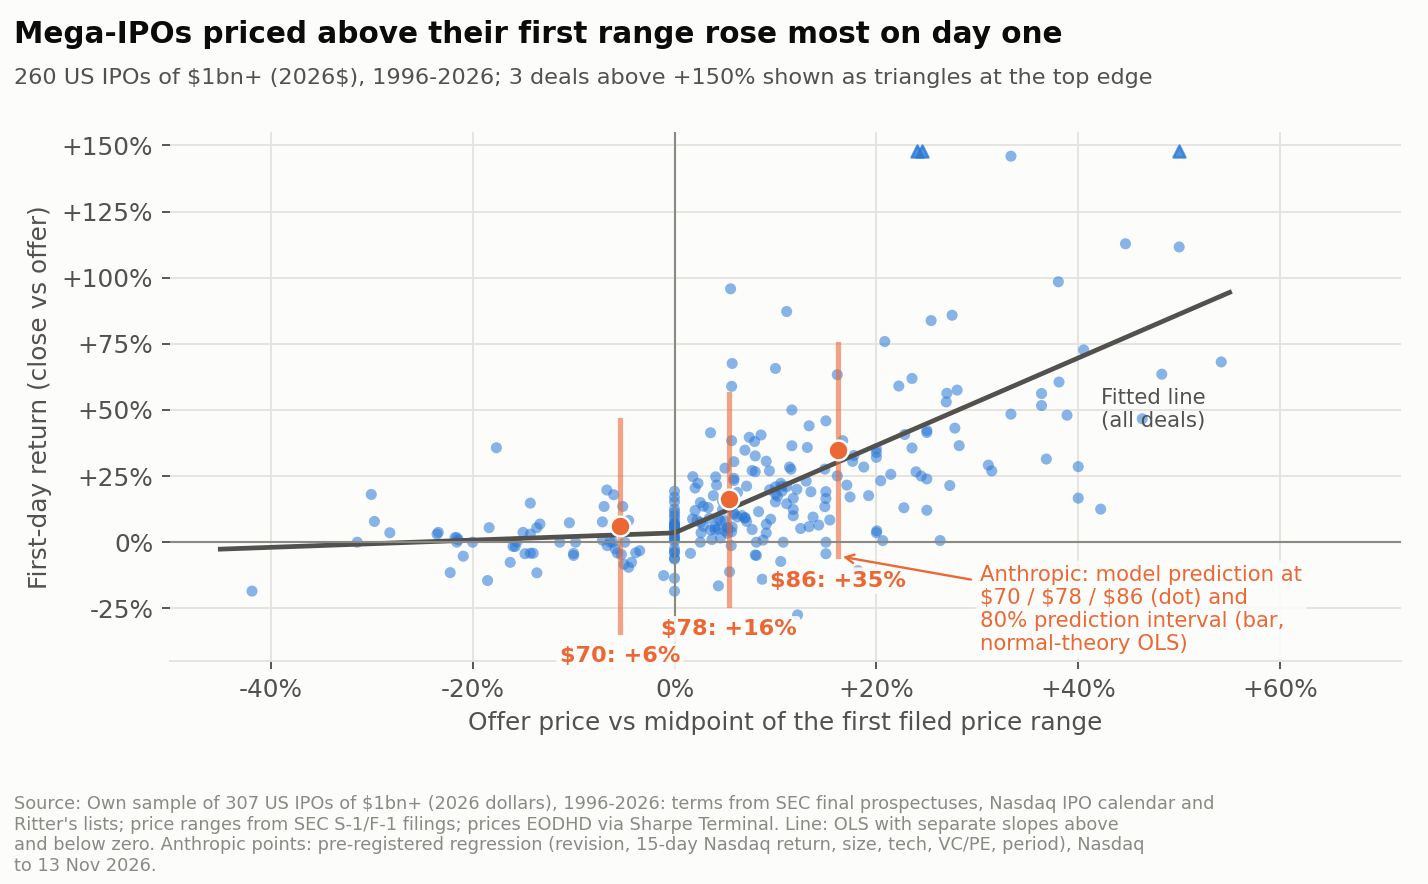
- Our pre-registered prediction for ANT (range $70-78, midpoint $74): about +6% if priced at $70, +16% at $78 and +35% at $86, with very wide 80% intervals (roughly -34% to +46%, -24% to +56% and -5% to +75%) [1, 2, 3, 5, 6, 7]. The model leaves out two things that may push the first day higher (Interpretation): a float of only 6.3% of shares and a book reported to be about six times covered [4, 8, 9].
- The year after has usually been worse than day one. Of mega-IPOs we can follow, 64% trailed their benchmark over the first year after the first close (median -17.5%; the mean of -8.3% is not significant, p = 0.07), and the bigger the first-day jump, the worse the next year [1, 2, 3, 6, 7]. A calendar-time portfolio shows no underperformance [6, 7, 10]. Our long-run data miss firms that later delisted, so better studies get more weight here: for IPOs of firms with $1bn+ sales, Ritter finds only -2.1 points against the market over three years [4].
- The price is neither obviously rich nor cheap. At $70-78 the fully diluted enterprise value is $1.05-1.19tn: 30-34x trailing revenue but 15.5-17.5x the third-quarter run rate [8, 11]. Damodaran's latest intrinsic value ($1.25tn equity, after earlier $1.45-1.48tn) sits just below the fully diluted range of $1.26-1.40tn [8, 11, 12]. The bigger question is margins under about $900bn of compute commitments, not the revenue multiple [8, 13]. (Interpretation.)
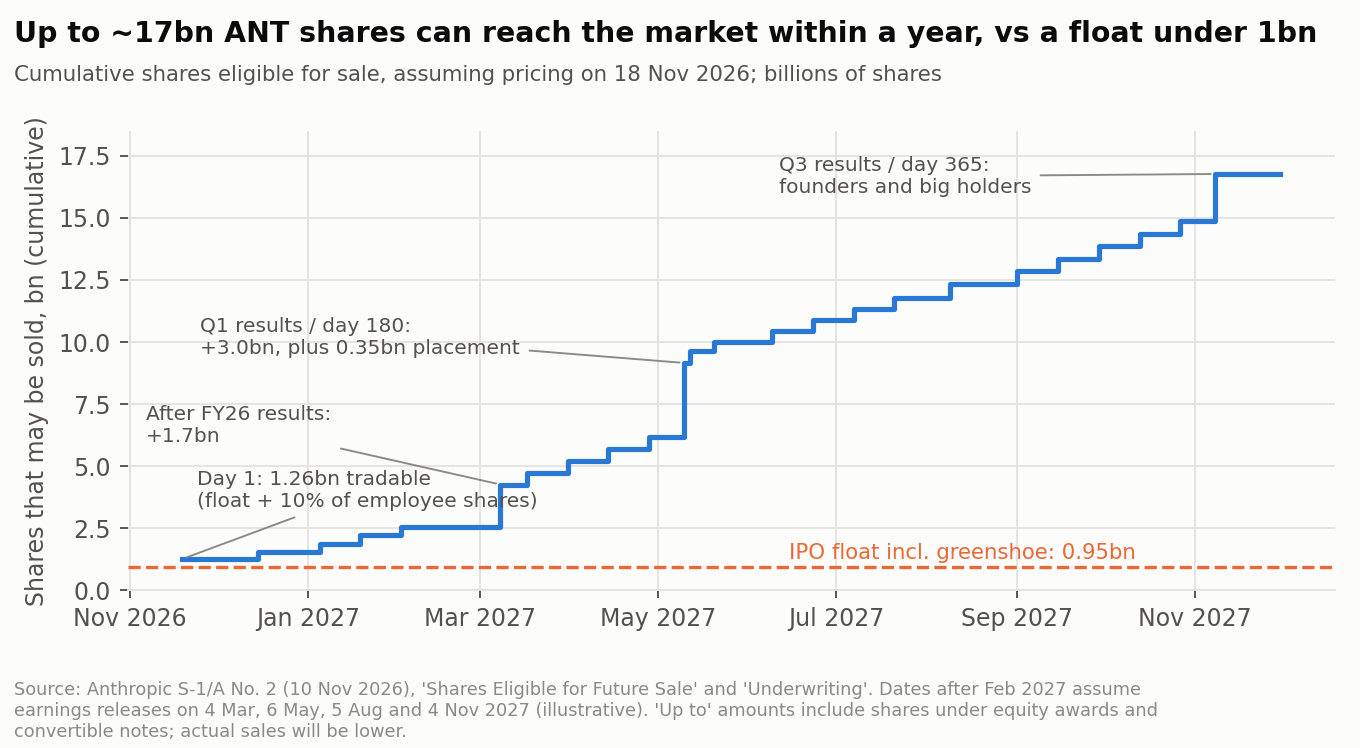
- Supply arrives in steps. Lock-ups release in 23 steps over a year, with up to 316m employee shares saleable from day one [8]. Russell, MSCI and the Nasdaq-100 can add ANT within weeks; the S&P 500 cannot for at least a year (its 12-month seasoning rule), and after that only once GAAP earnings turn positive [14, 15, 16, 17].
The deal in numbers
Anthropic, PBC sells 825m Class A shares at $70-78, 97% of them new; seven co-founders sell the rest [8]. In a concurrent private placement, seven suppliers (Google, Nvidia, AMD, Broadcom, Micron, Microsoft and TSMC) buy $26bn of non-voting Class N shares at the IPO price [8]. Goldman Sachs and Morgan Stanley lead a 22-bank syndicate [8]. Net proceeds from the IPO and the placement together are about $85bn at the midpoint [8]. Up to 20% of the IPO shares may go to retail investors in the US and abroad, including a European offer of up to 80m shares [8, 18].
Why headline valuations range from $0.9tn to $1.4tn. It is mostly the share count, not disagreement about the business. The share counts are our arithmetic from the filing; matching each press figure to a share basis is our interpretation [8, 19, 20, 21]:
| Basis at $70-78 | Shares | Equity value | Enterprise value |
|---|---|---|---|
| Basic (Class A + Class N outstanding after the IPO) | 13.09bn | $0.92-1.02tn | - |
| Fully diluted (options, RSUs, convertible notes) | ~18.0bn | $1.26-1.40tn | $1.05-1.19tn |
Sources: [8]. Enterprise value deducts about $213bn of pro forma cash [8]. The undrawn note facilities with Google, Amazon and Broadcom convert near market prices, so they are not fixed-price dilution [8].
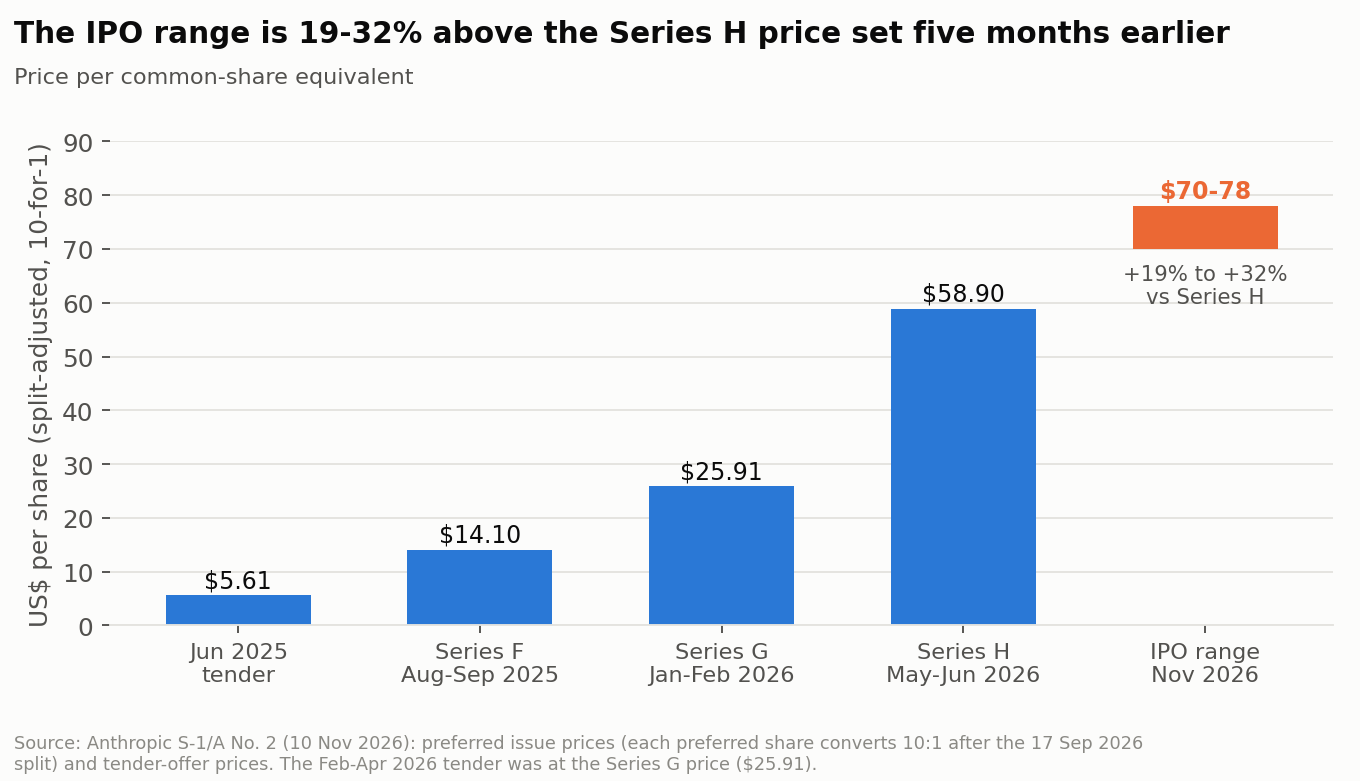
The step-up from the last private round is modest by the standards of this company's recent history: the range is 19-32% above Series H (May-June 2026), against 2.7-3.0x Series G and 5.0-5.5x Series F [8]. Over the same period company-defined run-rate revenue rose to about $81bn at 31 October [8, 20].
Is $70-78 rich or cheap?
Multiples. Trailing twelve-month revenue to September was $35.3bn and third-quarter revenue grew 1,127% from a year earlier [8]. On those numbers the price looks extreme. On the run rate it looks ordinary for a fast grower:
| Fully diluted EV at $70-78 divided by | Multiple |
|---|---|
| Trailing 12-month revenue ($35.3bn) | 29.8-33.7x |
| Q3 2026 revenue x 4 ($67.8bn) | 15.5-17.5x |
| October run-rate revenue ($81bn) | 13.0-14.7x |
Source: [8, 11]. Gross margin on a functional basis was about 85.5% in the first nine months of 2026, but total compute and infrastructure cost was 57% of revenue, because model-training compute sits in research and development [8]. The trailing GAAP operating margin was -11.6%; trailing free cash flow was about $5bn [8].
Peer regression. We fixed a peer rule before pulling data (US-listed software, internet and AI-exposed companies with at least $2bn of trailing revenue; 55 qualified) and regressed the log of EV/revenue on revenue growth and operating margin [22]. Growth and margin together explain only 14-34% of the variation in multiples, and growth alone is not statistically significant [22]. The null hypothesis that Anthropic's multiple lies inside the regression's 95% prediction interval is not rejected, but only on an assumed forward growth of about 100% applied to run-rate revenue, and the intervals are so wide (roughly 6x to 231x revenue) that this says little [8, 22]. On reported growth Anthropic is so far outside the peer range that the model can only extrapolate.
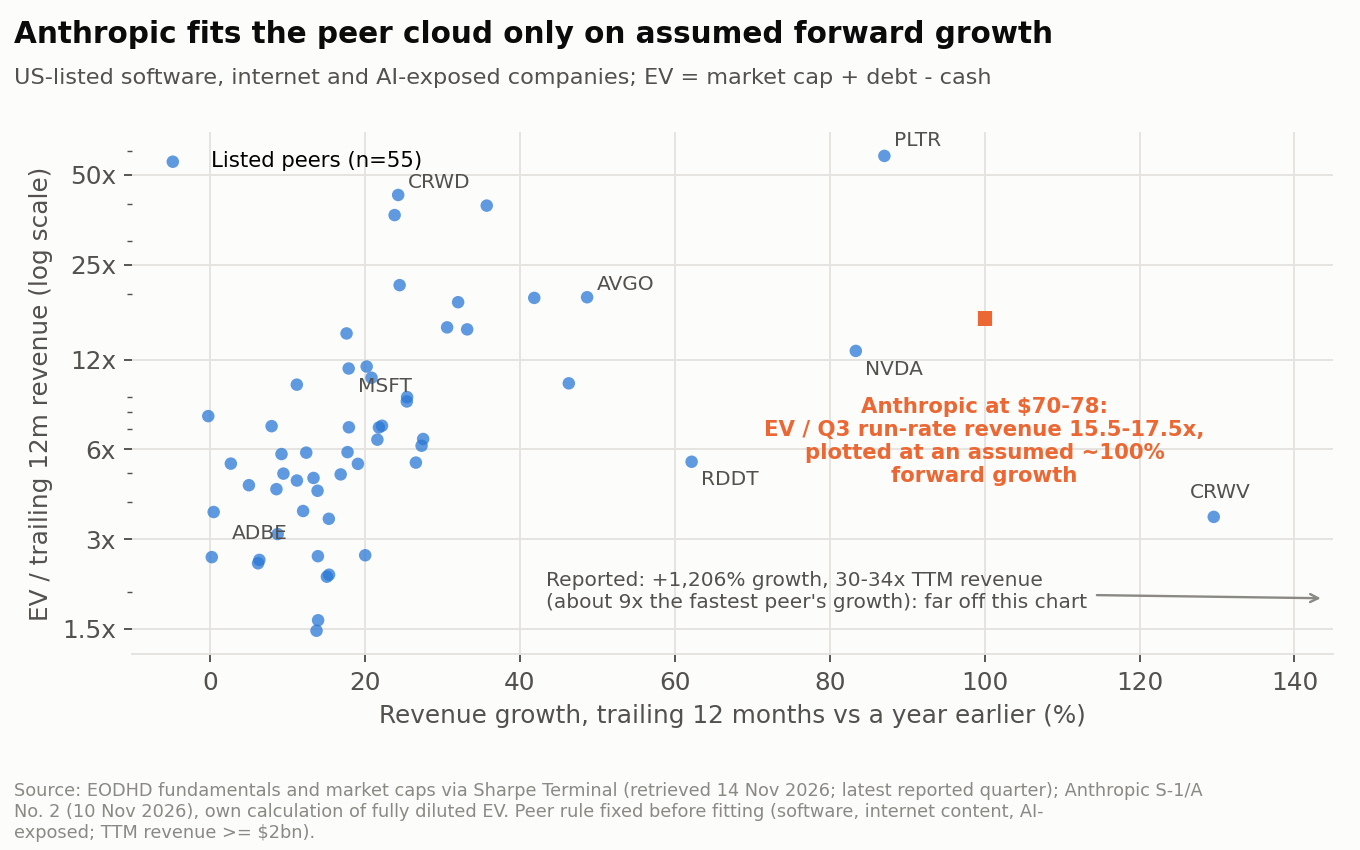
How much weight does this deserve? Not much on its own. Kim and Ritter found that comparable-firm multiples put no more than 27% of IPO valuations within 15% of the actual multiple, and sales multiples were among the weakest tools [23]. Purnanandam and Swaminathan, with more than 2,000 IPOs, found that issuers priced on optimistic growth relative to peers popped on day one and then underperformed [24]. Their study is stronger than our regression, and its logic warns against exactly the forward-growth view that makes Anthropic look fair. We weight our regression at perhaps a fifth of the overall judgement (Interpretation).
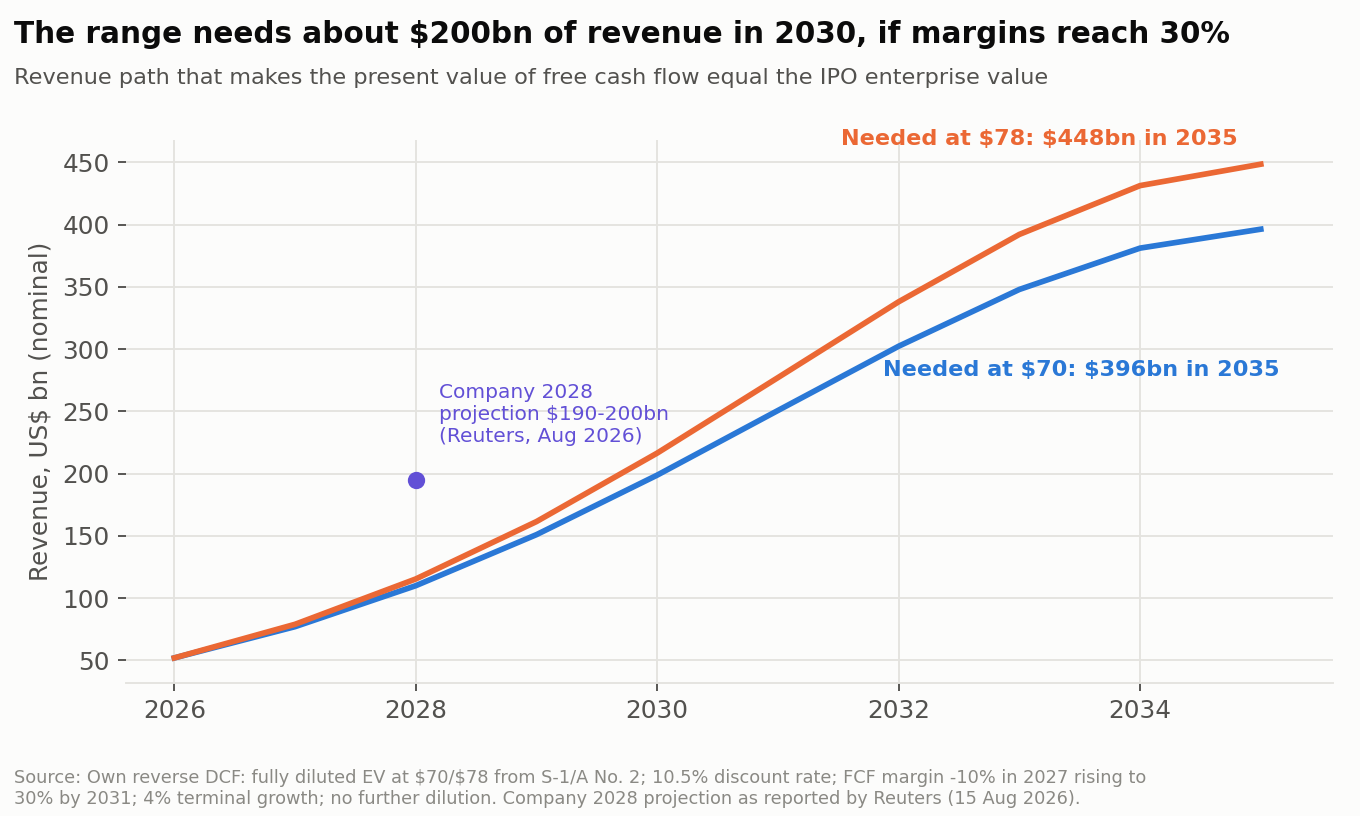
What the price needs. A reverse discounted-cash-flow model (10.5% discount rate, free-cash-flow margin rising from -10% in 2027 to 30% by 2031, 4% terminal growth) needs about $199-217bn of revenue in 2030 and $396-448bn in 2035 to justify $70-78 [8]. The path needs about $110-115bn in 2028, well below the company's reported projection of $190-200bn for that year (Estimate, Reuters reporting) [25]. The catch is cost: honouring the disclosed compute commitments on that minimal path means compute would exceed revenue in 2028-29, and the path then needs $221-237bn of 2030 revenue and burns $160-175bn of cash first [8]. Committed spend is about $900.9bn, of which $451.6bn falls before the end of 2030 [8, 13].
Published valuations. Aswath Damodaran's story-based DCF put the equity at $1.48tn on 28 October and $1.45tn after third-quarter figures, then $1.25tn after he raised his compute and regulatory assumptions [11, 12]. His latest figure sits just below the fully diluted range; on his numbers the range looks fair, not cheap. In one study of French IPOs, underwriters set the preliminary price 18.2% below their own fair-value estimate on average [26]; if US banks behave similarly, ranges are conservative by design (Interpretation).
Our reading (Interpretation, moderate confidence). The range prices a successful but not heroic outcome. The case against it is real: 30-34x trailing revenue, about 211x last fiscal year's revenue on basic shares [8], a governance structure that leaves public Class A holders with about 5.5% of votes [8, 16], and a Public Benefit Fund that can receive up to 2% more shares each time the price rises 50% [8]. A price of $86 or more (about $1.55tn fully diluted) would sit above Damodaran's latest value and above the run-rate multiples that put the range level with peers [8].
Who is buying
- The book. Bloomberg reported on 12 November that orders covered the deal about six times and that existing backers would get priority [9]. Research on bookbuilding finds that oversubscription is positively related to first-day returns [27]. No study tests press-reported cover multiples, so "6x" is a direction, not a measurement (Interpretation).
- The suppliers. The $26bn placement equals 42.6% of the base IPO share count [8]. At least $12.5bn of it is money already committed: Google's $10bn exercises an option under its existing note facility, and AMD's $2.5bn counts toward a GPU-linked equity pledge [8]. The placement shares carry no lock-up, only Rule 144 restrictions, so they can be resold from about May 2027 [8]. These are buyers whose return also comes from selling chips and compute to Anthropic (Interpretation; no academic study covers suppliers buying in a concurrent placement).
- Insiders. Directors and affiliates indicated interest in buying up to $303m of shares [8]. The co-founders sell about 1.4% of their stakes [8, 28].
- Index funds. Under 2026 rules ANT can enter Russell indexes after its fifth trading day, MSCI at the close of its tenth and the Nasdaq-100 after its fifteenth [15, 16, 17]. We estimate Nasdaq-100 passive buying at roughly $2.5-8bn (Estimate, low confidence) [8, 15, 29, 30, 31]. The S&P 500 kept its rule requiring positive GAAP earnings, and Anthropic's nine-month GAAP net loss was $104bn, mostly a non-cash loss on convertible notes [8, 14].
- Expectations. On 14 November the betting market Polymarket (a gauge of sentiment, not evidence) priced an 89% chance that ANT closes its first day above the offer [32]. In our sample, 78.6% of mega-IPOs closed above the offer [1, 2, 3]. The market-cap brackets traded on the same platform are hard to read because they do not say whether they count basic or fully diluted shares [8, 9, 19].
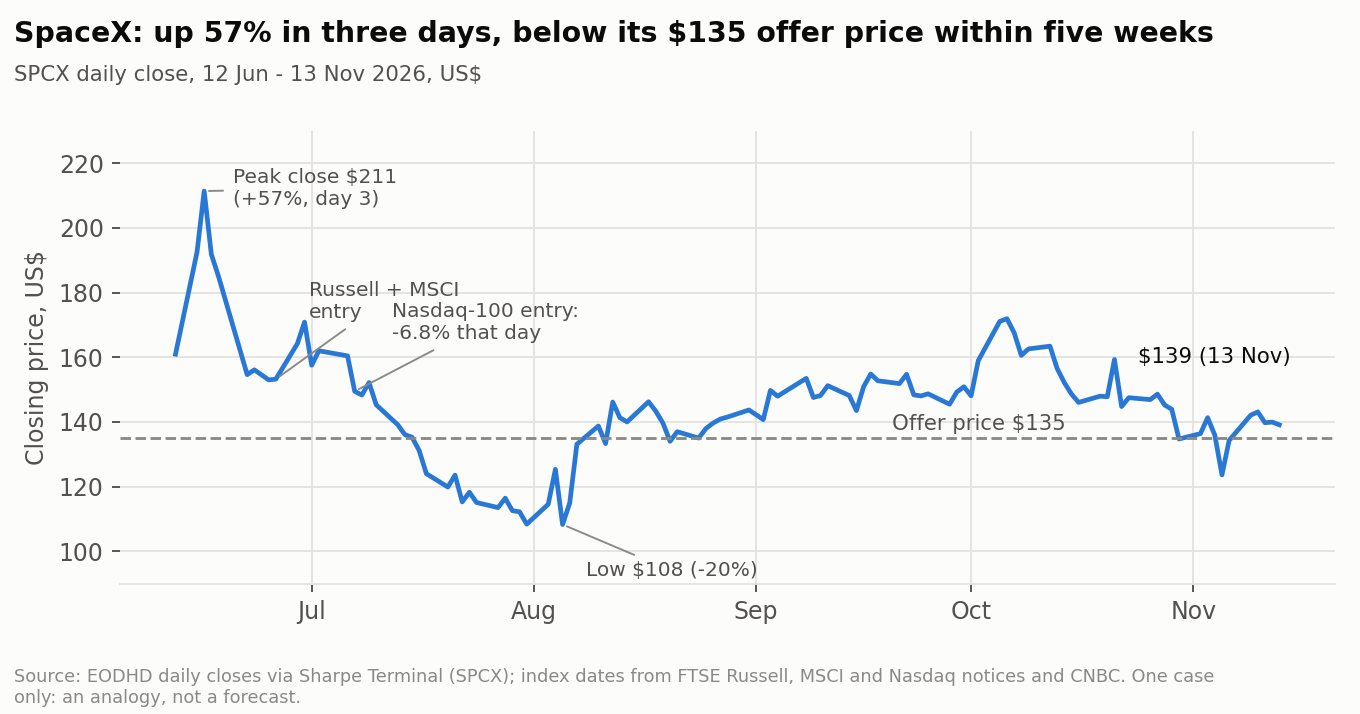
The one live precedent. SpaceX priced at $135 in June 2026, closed its first day up 19.2%, peaked 56.6% above the offer on its third trading day, fell 6.8% on its Nasdaq-100 entry day and traded below the offer within five weeks [33, 34]. Measured against the Nasdaq Composite, it gained 2.3% into its Russell and MSCI entry and lost 4.1% around its Nasdaq-100 entry [6, 7]. One event cannot test anything, and the period included an AI-stock sell-off.
What 307 mega-IPOs say about day one
Sample. We hand-collected US firm-commitment IPOs with base proceeds of at least $1bn in 2026 dollars from 1996 to 13 November 2026. The list is close to complete from 2017 (deal counts match Renaissance Capital's) but is not a full census before that, and earlier years lean towards deals that drew press coverage. There are 324 candidates, of which 307 remain after removing global privatisations without a US-tranche price, cross-listings of already-traded firms and one subscription offering [1, 2, 3]. Deal terms come from final prospectuses, the Nasdaq IPO calendar and Ritter's lists; the first and final filed price ranges come from each issuer's registration statements on SEC EDGAR; first-day closes come from price data and, for 62 later-delisted firms, from press reports [1, 2, 3].
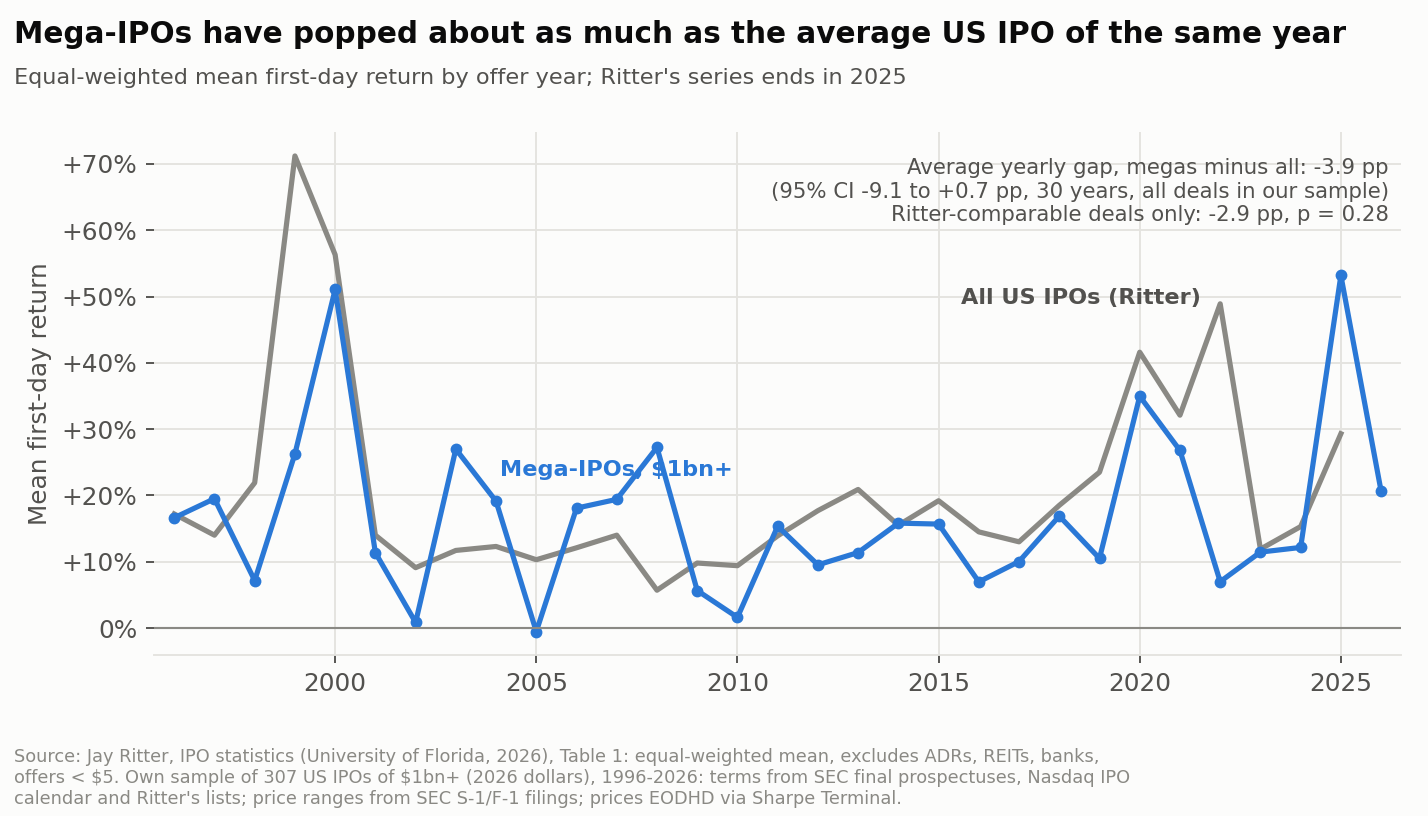
Day one. The average first-day return was 20.2% (95% CI 16.4% to 24.1%) [1, 2, 3]. Tech mega-IPOs averaged 34.2%, others 11.9% [1, 2, 3]. Twenty-six deals still lack a first-day close; setting all of them to the sample's worst return still leaves a mean of 16.2% [1, 2, 3]. The missing data are not random: the 62 delisted firms we hand-collected averaged only 3.1% on day one, so a sample built only from today's price feeds would overstate first-day returns [1, 2, 3].
Are big deals priced differently? Ritter's averages for all US IPOs give a same-year benchmark. On deals comparable to his sample, megas averaged 2.9 points less than their year's average, which is not statistically significant (p = 0.28) [1, 2, 3, 4]. Ritter's own data show that firms with large sales pop less (13.3% against 19.1% in 2001-2025) [4]; our result is about large deals, a different size measure.
Partial adjustment. Bankers raise the price when demand is strong but do not raise it all the way, so deals priced above their range rise more on day one. This was first shown by Hanley [35] and confirmed many times. It holds for megas: 41% priced above their first range [1, 2, 3, 5], and the regression coefficient on upward revisions is 1.74 (95% CI 1.14 to 2.34, p < 0.001, robust to clustering by year, winsorising and median regression) [1, 2, 3, 5]. Downward revisions have no significant effect [1, 2, 3, 5]. Lowry and Schwert found the same asymmetry in all IPOs, with a smaller slope [36].
Two nulls, honestly reported. The Nasdaq's return over the 15 trading days before pricing shows no effect in our data (coefficient -0.02, 95% CI -1.23 to 1.20) [1, 2, 3, 6, 7]. Loughran and Ritter found a slope of 1.33 in a larger sample, in a regression without the price revision [37]. Our comparable model without the revision gives 0.28, with an interval (-1.12 to 1.67) that includes their estimate, so on that specification our null is weak evidence. With the revision in the model, our interval (-1.23 to 1.20) excludes 1.33, which matches Lowry and Schwert: they found no extra market effect once the revision is controlled [36]. The market move appears to work through the price revision rather than on top of it (Interpretation). Deal size within the mega group also shows no effect [1, 2, 3].
Our prediction for ANT, stated before pricing
The pre-registered regression uses the price revision against the $74 midpoint, the Nasdaq's return over the 15 trading days to 13 November (-3.16%) [7], log deal size, tech and venture backing, and period. The three offer prices were fixed before any data was collected:
| Offer | Revision vs $74 | Predicted first-day return | 80% interval (normal-theory) | 80% interval (empirical residuals) |
|---|---|---|---|---|
| $70 | -5.4% | +6.2% | -33.8% to +46.1% | -22.4% to +29.1% |
| $78 | +5.4% | +16.3% | -23.6% to +56.2% | -12.3% to +39.2% |
| $86 | +16.2% | +34.8% | -5.2% to +74.8% | +6.2% to +57.7% |
Sources: [1, 2, 3, 5, 6, 7]. We lead with the conventional normal-theory interval; the empirical version, built from the model's skewed residuals, was added after seeing the data and is shown for comparison. Among past megas priced 10-25% above their range midpoint, 42.6% rose more than 25% on day one and 8.8% closed below the offer [1, 2, 3, 5].
Why the model may be too low (Interpretation). It cannot see the float or the order book. Ritter finds that IPOs floating 10% or less of their shares averaged a 32.4% first-day return, against 7.6% for floats above 40% [4]; ANT floats 6.3% [8]. Why it may be too high. ANT is twice the size of the largest deal in the regression sample (Alibaba, $30.6bn); SpaceX was larger but had no price range, so it is not in the regression [8, 38]. The supplier placement has no precedent in the sample. A deal this large must clear with many marginal buyers, and SpaceX's first day (+19%) was well below the tech-mega average [1, 2, 3, 33, 34].
How we will score it. After the first day of trading we will report the actual offer price and first-day return, re-run the same model at the actual revision, and say whether the outcome fell inside the 80% interval. We will also track the one-year and lockup predictions below.
After day one: the long run, lockups and index entry
The first year. From the first close, mega-IPOs we can follow trailed their benchmark by 8.3% on average over a year (median -17.5%; skewness-adjusted t = -1.81, p = 0.07) [1, 2, 3, 6, 7]. Over three years the median was -30.2% but the mean (-5.5%) was not significant, because a few big winners pull it up [1, 2, 3, 6, 7]. A calendar-time portfolio, which avoids double-counting overlapping deals, shows no underperformance (alpha +0.30% a month, t = 0.93) [6, 7, 10]. Higher first-day returns predicted lower one-year returns [1, 2, 3, 6, 7]. That sits uneasily with Ritter's finding that IPOs which fell on day one did worse over three years than those that rose (-32.0 against -8.5 points) [4], and our own three-year split by sign points the same way as his. A likely reading (Interpretation): a few very large first-day jumps were followed by poor returns, while the small group that fell on day one also did badly.
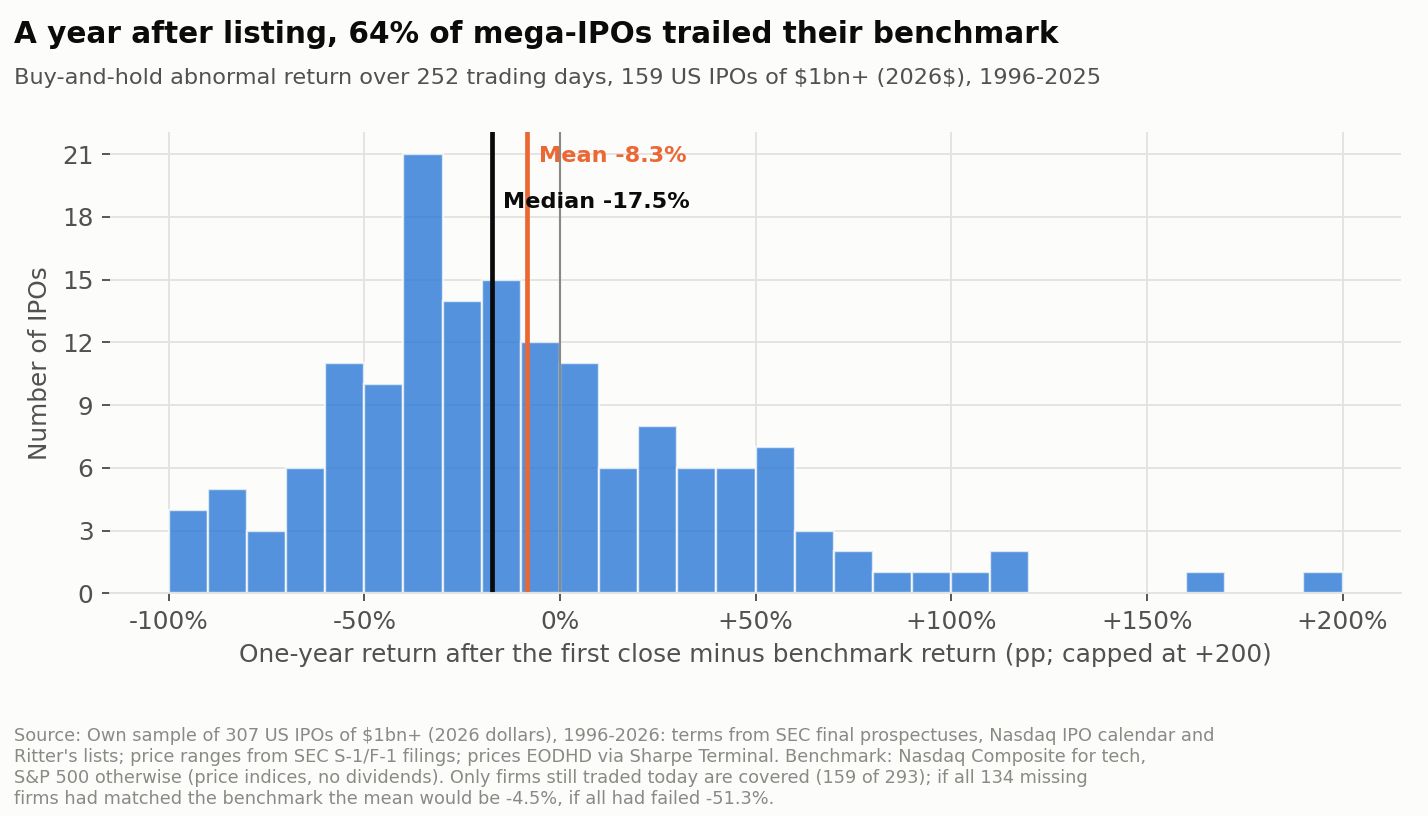
Why better studies should outweigh ours here. Our price data cover only firms still traded today: 159 of 293 eligible deals at one year [1, 2, 3, 6, 7]. If all the missing firms had matched the benchmark, the mean would be -4.5%; if all had failed, -51.3% (bounds from our results). Studies built on CRSP data, which include delisted firms, dividends and delisting returns, are stronger. They find little or no long-run underperformance for IPOs by firms with large sales or with venture backing [4, 39], and that measured underperformance depends heavily on the method [40], but poor returns for the 2011-2024 cohorts (-24.7 points against the market over three years) [4] and for IPOs valued at more than 40 times sales at the first close (-58.5 points) [4]. At $74 ANT's basic market value is about 27x trailing revenue, so a first-day close of about $108 (+46%) would put it above 40x on that measure (our arithmetic) [8]. The comparison is loose (Interpretation): Ritter's high-multiple IPOs were far smaller companies, and trailing sales are a poor yardstick for a firm growing more than tenfold a year.
Lockups. Around scheduled lockup expiry, mega-IPO shares lagged the market by 1.3% over days -5 to +5, which is not significant (p = 0.16); over days -1 to +1 the average was 0.0% (95% CI -1.0% to +1.0%) [6, 7]. Field and Hanka found -1.5% over three days in nearly 2,000 lockups with known dates [41], which our three-day interval excludes. We assumed a 180-day lockup for most deals, and a wrong event date blurs a short-window effect, so their estimate remains the better guide. ANT's lock-up is unusual: up to 1.6bn shares become saleable before any earnings release, 1.7bn after the FY2026 results and 3.0bn at day 180 or the Q1 results [8].
Index entry. Additions to the S&P 500 used to earn about 7.6% in the 1990s but only about 0.8% in the last decade [42]. Pre-announced index buying is known in advance and can be traded ahead of; SpaceX fell on its Nasdaq-100 day. We found only three comparable fast-entry events, all SpaceX, too few for a test.
How our results compare with published research
| Question | Our result | Best published comparison | Whose design is stronger | Weighing |
|---|---|---|---|---|
| Average first-day return | 20.2% (281 megas with a close, 1996-2026) | 19.0% (9,345 US IPOs, 1980-2025) [4] | Theirs (complete census, CRSP) | Agree: megas are no exception on average |
| Megas vs same-year average | -2.9 points, not significant (significant if the missing deals did badly); +8.8 points vs large-sales IPOs | Big-sales firms 13.3% vs 19.1% [4] | Theirs on firm size; ours on deal size | Different size measures; no clear conflict |
| Partial adjustment | +1.74 per point of upward revision | Above range 50% / within 12% / below 3% [4] | Theirs (larger n) | Agree; megas above range pop a bit less |
| Pre-offer market return | No effect with or without the revision (wide intervals) | Slope 1.33 without revision [37]; no extra effect with it [36] | Theirs | Split by specification; ours matches Lowry-Schwert |
| One-year / three-year returns | -8.3% / -5.5% mean, survivors only | $1bn+ sales: -2.1 points over 3 years [4] | Theirs (no survivorship bias) | Theirs dominates; ours adds 2017-2026 megas |
| Lockup expiry | -1.3% over 11 days (n.s.); 0.0% over 3 days | -1.5% over 3 days [41] | Theirs (known lockup dates) | Theirs should outweigh ours |
What our sample adds: a deal-size definition in 2026 dollars that no published study isolates, the 2017-2026 megas (Arm, Cerebras, Figma, SpaceX and others) that most academic samples miss, foreign issuers listed in the US, and price ranges taken directly from the filings.
What we don't know
- The final price and allocation. Everything here is conditional on a price not yet set.
- The share basis behind market expectations. Prediction-market brackets and some press valuations do not say whether they use basic or diluted shares [8, 9, 19].
- How the order book and the 6.3% float interact with size. No past deal combines this size, this float and a supplier placement.
- Long-run returns of delisted megas. We lack them for about 45% of eligible deals; the bounds above are wide.
- Whether margins survive the compute bill. The valuation turns on this, and the filing gives commitments, not future pricing power [13].
Method
- Pre-registration. Nine null hypotheses (first-day underpricing, megas vs same-year average, partial adjustment, pre-offer market return, size, one- and three-year abnormal returns, valuation vs peers, lockup expiry, index entry), the sample rule, variables and the three ANT pricing scenarios were fixed on 14 November 2026, before data collection.
- Changes after data collection, before any test: the same-year comparison is run on deals comparable to Ritter's sample (no ADRs, REITs or banks); deals launched at a fixed price without a range (SpaceX) are left out of the regression; the market-return test is reported with and without the revision terms; long-run returns use price indices to match price-only stock returns, with delisted firms bounded and a calendar-time check; cross-listings of already-traded firms are excluded.
- Changes after the tests: the empirical prediction interval was added as a robustness check. A float control was planned but dropped because post-IPO share counts were not collected. Lockup lengths are known for only 9 of 163 events.
- Tests: t-tests with robust (HC3) standard errors, Wilcoxon signed-rank tests and bootstrap confidence intervals; OLS with HC3 errors and a wild-cluster bootstrap by year; skewness-adjusted t-statistics for long-run returns [43]; Holm-adjusted p-values across the hypotheses. Only the first-day mean, partial adjustment and the day-one/one-year slope survive the Holm adjustment.
- Data: SEC EDGAR filings, the Nasdaq IPO calendar, Jay Ritter's IPO statistics [4], Renaissance Capital, press reports, and daily prices from EODHD (split-adjusted, without dividends). The Anthropic figures come from its registration statements [8, 13].
Disclosure
The author has applied for shares in the IPO. Claude Opus 5.5, an AI model made by Anthropic, was used to help research and write this article.
Sources
- EOD Historical Data (2026). Raw end-of-day share prices around each IPO date (US mega-IPOs). EOD Historical Data (EODHD). Accessed 2026-11-14.
- Jay R. Ritter (2026). Money Left on the Table in IPOs by Firm. University of Florida. Accessed 2026-11-14.
- Renaissance Capital (2026). Renaissance Capital IPO profile pages (public part): First Day Return and IPO date, 43 deals. Renaissance Capital (renaissancecapital.com/Profile/<ticker>). Accessed 2026-11-15.
- Jay R. Ritter (2026). Initial Public Offerings: Updated Statistics. University of Florida, Warrington College of Business. Accessed 2026-11-13.
- US Securities and Exchange Commission (EDGAR filings by the issuers) (2026). First and final filed IPO price ranges, from issuers' S-1/F-1 registration statements and amendments. US Securities and Exchange Commission (EDGAR). Accessed 2026-11-15.
- EOD Historical Data (EODHD) (2026). Split-adjusted daily closing prices of US mega-IPO stocks. Accessed 2026-11-15.
- EOD Historical Data (EODHD) (2026). Nasdaq Composite and S&P 500 daily closes, 1995-2026. Accessed 2026-11-15.
- Anthropic, PBC (2026). Anthropic, PBC Form S-1/A (Amendment No. 2), with IPO price range, November 10, 2026. SEC EDGAR. Accessed 2026-11-13.
- Bailey Lipschultz (2026). Anthropic's IPO Is About Six Times Oversubscribed. Bloomberg News (syndicated on Yahoo Finance). Accessed 2026-11-14.
- Board of Governors of the Federal Reserve System (via FRED) (2026). 3-Month Treasury Bill Secondary Market Rate, monthly (TB3MS). Federal Reserve Bank of St. Louis, FRED. Accessed 2026-11-15.
- Aswath Damodaran (2026). Musings on Markets front page: posts of 3 and 9 Nov 2026 on Anthropic. Musings on Markets (Blogspot). Accessed 2026-11-14.
- Aswath Damodaran (2026). The Anthropic Prospectus Arrives: My (but not the) IPO valuation (slide deck 'To trillions and beyond!'). NYU Stern / Musings on Markets. Accessed 2026-11-14.
- Anthropic, PBC (2026). Anthropic, PBC Form S-1/A (Amendment No. 1), with financial statements through September 30, 2026. SEC EDGAR. Accessed 2026-11-12.
- S&P Dow Jones Indices (2026). S&P Dow Jones Indices Consultation on Treatment of MegaCap Companies - Results (4 Jun 2026). S&P DJI via PR Newswire. Accessed 2026-11-14.
- Nasdaq Global Indexes (2026). Nasdaq-100 Index Methodology Changes: Frequently Asked Questions (July 2026, Q&A added 31 Jul 2026). Nasdaq. Accessed 2026-11-14.
- FTSE Russell (2026). Market Consultation: Russell US Equity Indexes IPO Fast Entry and Minimum Eligibility Requirements (results, 26 May 2026). LSEG FTSE Russell. Accessed 2026-11-14.
- MSCI (2026). US: Space Exploration Technologies - Initial Public Offering - Update - MSCI Global Standard Indexes (8 Jun 2026). MSCI index announcements. Accessed 2026-11-14.
- Anthropic, PBC (2026). Anthropic, PBC: Summary of the (BaFin-approved) European Prospectus for the European and Swiss retail offerings. Anthropic / BaFin. Accessed 2026-11-14.
- Renaissance Capital (2026). Anthropic sets terms for $61 billion IPO, targeting a $1.2 trillion market cap. Accessed 2026-11-12.
- Beatrice Nolan (2026). Anthropic sets IPO range valuing it at up to $1.4 trillion amid AI stock sell-off. Fortune. Accessed 2026-11-14.
- Cristian Dina (2026). Anthropic's IPO seeks up to $64.4B at a $1.4 trillion valuation. The Next Web. Accessed 2026-11-14.
- EOD Historical Data (EODHD) (2026). Quarterly fundamentals and market capitalisations of US-listed software, internet and AI-exposed companies. Accessed 2026-11-14.
- Moonchul Kim, Jay R. Ritter (1999). Valuing IPOs. Journal of Financial Economics 53(3):409-437. Accessed 2026-11-14.
- Amiyatosh K. Purnanandam, Bhaskaran Swaminathan (2004). Are IPOs really underpriced?. Review of Financial Studies 17(3):811-848. Accessed 2026-11-14.
- Reuters (2026). Anthropic IPO valuation hinges on $190-200 billion 2028 revenue forecast, sources say. Reuters (republished by ARY News). Accessed 2026-11-14.
- Peter Roosenboom (2007). How Do Underwriters Value Initial Public Offerings? An Empirical Analysis of the French IPO Market. Contemporary Accounting Research 24(4), 1217-43. Accessed 2026-11-14.
- Francesca Cornelli, David Goldreich (2003). Bookbuilding: How Informative Is the Order Book?. Journal of Finance 58(4), 1415-1443. Accessed 2026-11-14.
- Cristian Dina (2026). Anthropic's IPO is reportedly oversubscribed as founders sell $1.75bn. The Next Web. Accessed 2026-11-14.
- Cris Tolomia (2026). SpaceX joins Nasdaq-100 index, triggering passive fund buying. Quartz (via Yahoo Finance). Accessed 2026-11-14.
- Isabelle Lee, Lu Wang (2026). SpaceX Bears Brace for Billions in Passive Index-Fund Buying. Bloomberg News (via WealthManagement.com). Accessed 2026-11-14.
- Yun Li (2026). SpaceX to join the Nasdaq-100 in a fast-tracked process that will drive huge ETF buying demand. CNBC. Accessed 2026-11-14.
- Polymarket (2026). Polymarket: Anthropic IPO prediction markets (snapshot 14 Nov 2026). Accessed 2026-11-14.
- EOD Historical Data (EODHD) (2026). SpaceX (SPCX) daily closes and volume, June-November 2026. Accessed 2026-11-14.
- Space Exploration Technologies Corp. (2026). Space Exploration Technologies Corp. Form 10-Q for quarter ended 30 Sep 2026. SEC EDGAR. Accessed 2026-11-12.
- Kathleen Weiss Hanley (1993). The underpricing of initial public offerings and the partial adjustment phenomenon. Journal of Financial Economics 34(2):231-250. Accessed 2026-11-14.
- Michelle Lowry, G. William Schwert (2000). IPO Market Cycles: Bubbles or Sequential Learning? (NBER Working Paper 7935). NBER (published Journal of Finance 57(3):1171-1200, 2002). Accessed 2026-11-14.
- Tim Loughran, Jay R. Ritter (2002). Why don't issuers get upset about leaving money on the table in IPOs?. Review of Financial Studies 15(2):413-443. Accessed 2026-11-14.
- Space Exploration Technologies Corp. (2026). Space Exploration Technologies Corp. final prospectus (424B4), IPO of Class A common stock. SEC EDGAR (CIK 1181412, accession 0001628280-26-042639). Accessed 2026-11-14.
- Alon Brav, Paul A. Gompers (1997). Myth or reality? The long-run underperformance of initial public offerings: evidence from venture and nonventure capital-backed companies. Journal of Finance 52(5):1791-1821. Accessed 2026-11-14.
- Paul Gompers, Josh Lerner (2003). The really long-run performance of initial public offerings: the pre-Nasdaq evidence. Journal of Finance 58(4):1355-1392. Accessed 2026-11-14.
- Laura Casares Field, Gordon Hanka (2001). The expiration of IPO share lockups. Journal of Finance 56(2):471-500. Accessed 2026-11-14.
- Robin Greenwood, Marco Sammon (2022). The Disappearing Index Effect (NBER Working Paper 30748). NBER (published Journal of Finance 80(2):657-698, 2025). Accessed 2026-11-14.
- John D. Lyon, Brad M. Barber, Chih-Ling Tsai (1999). Improved methods for tests of long-run abnormal stock returns. Journal of Finance 54(1):165-201. Accessed 2026-11-14.